- Staking Insider
- Posts
- Staking Insider #4
GM fellow staker,
Friday has landed! We’re rounding this week off with some more tips to help you navigate the $92.85b staking industry…
🧵 In this week’s edition:
👀 A Smarter Way to Compare Staking Providers
📰 Weekly Briefing
🤓 Metric of the Week
📈 TVL: Liquid Staking Tokens vs. Vanilla Staking
Read time: 3 minutes
🧠 A Smarter Way to Compare Staking Providers
Over 80% of users spend less than 30 minutes selecting a Staking Provider.
This often results in an uninformed decision that can impact those juicy staking rewards 😔.
Instead of chasing a narrative, it’s always better to DYOR!
To help you out, we’ve just launched a new Beta feature on our website. You can now compare Staking Providers side-by-side, with access to real-time performance data, that would otherwise remain hidden.
Choose a Provider that suits your own staking needs by comparing the Reward Rate, Fee, Staked Tokens in the network, Network Control, Number of Stakers and the 7 Day Net Staking Flow.
Compare 250+ providers across 70 different POS Assets, including Ethereum, Cosmos, Solana, BNB Chain, Avalanche, Polkadot, Cardano and more.
Simply head to the Asset Explorer (beta), select an asset and scroll down to view the available providers. Start making more informed staking decisions today 🙌.
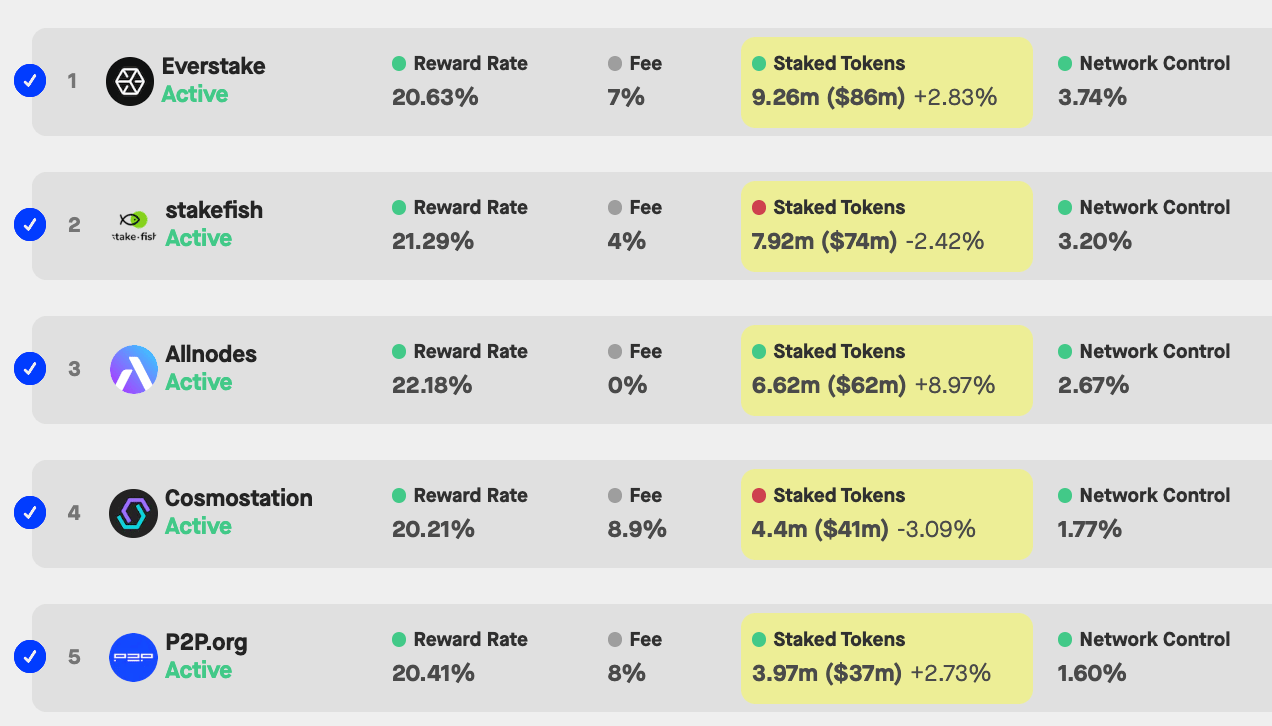
Pro tip: Use the “Verified Staking Providers” toggle to view providers that our team has already audited to support your research.
📰 Weekly Briefing
More top news this week from the world of crypto & staking…
Multichain issues urgent warning amid $126 million asset outflow
BlackRock CEO Larry Fink Says Bitcoin Could ‘Revolutionize Finance’
The TVL in Solana’s liquid staking protocols has surged by 91% year-to-date
Archway goes live on mainnet in the Cosmos ecosystem
🤓 Metric of the week
The Staking Asset Explorer is a treasure trove of data!
This week we’re drawing your attention to the Daily Volume, one of 18 metrics available to view across 70 different POS assets.
The Daily Volume represents the aggregate trading volume of all trading pairs for the asset over the past 24 hours. This metric provides insights into the level of market activity and liquidity for a given asset, and can be used to identify trends in trading activity and investor sentiment.
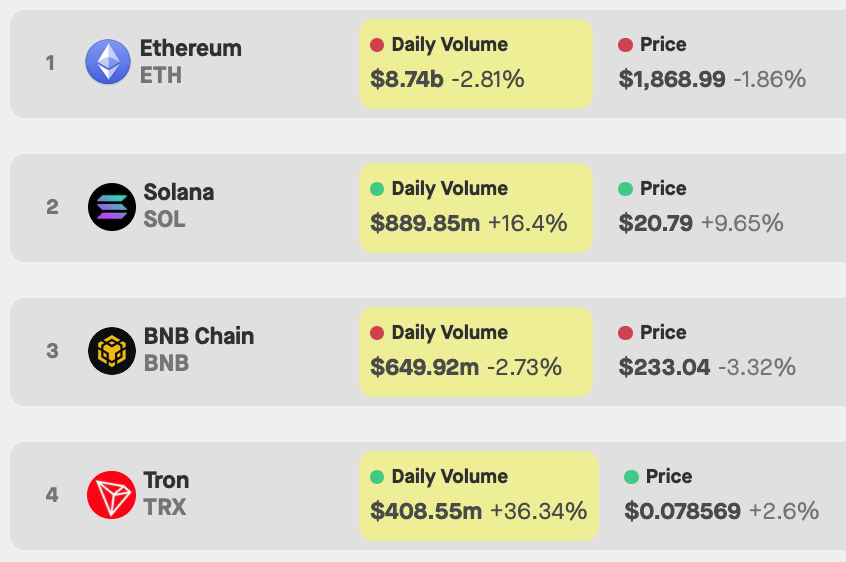
You can change the time frame to compare the daily volume against averages across a 7 day, 30 day, 90 day or 1 year timeframe. The example screenshot above shows % change against the 7 day average.
The Daily Volume metric updates every 5 minutes, so be sure to refresh to get the latest market insights when looking at the comparison view.
📈 TVL: Liquid Staking Tokens vs. Vanilla Staking
The total value locked in Ethereum Liquid Staking Tokens is now a whopping 48.19% of the entire Ethereum Staking Market Cap.

Liquid Staking Tokens vs. Vailla Staking
📡 Projects to Keep on Your Radar
In case you hadn’t already, get early access to two special launches we have in the works.
🎬 That’s a wrap!
We’re stoked to have you subscribed to the Staking Insider. Let us know what you thought of this week’s edition…
Disclaimer: None of this is financial advice. The Staking Insider newsletter is strictly for educational purposes and is not investment advice. Please be careful and always do your own research.
Reply